
𓍊𓋼𓍊𓋼𓍊𓆏𓍊𓋼𓍊𓋼𓍊
mental load & association for necessary cultural actions present
SACRED TRICKSTER
shows
for loud, improvised, and verrrry experimental shows near you
-
23.05.
SACRED TRICKSTER: Barnabaie | LeoniLeoni @ Salon der Herzen06.05.
SACRED TRICKSTER: TRHOLZ | 3a3h3n3d3i | Ipek Odabaşı21.04.
SACRED TRICKSTER x collage soundsystem: Almond Butyl | Rose Felicity21.04.
LATE NIGHT by clementine x mental load: OONAGH HAYNES | PRINCE HARVEY -
13.12.
helen island | guilt princess & dj mental load26.11. jazz lambaux: music for fools unplugged | tina muffler: SAD CLOWN OPERA | 300skullsandcounting
01.11. CONNY FRISCHAUF | FLUTORAMA | OIOX aka Pam
23.10. doresale | ASP Doze
03.09. horizontaler gentransfer | milla pluton29.08. gorz | angelfightrrr
15.07. Quantum Dregz | Les percussions de la montagne verte
18.06. Marcel Wave | Ramon Keimig
17.06. KANONENGASSE x ART BASEL hosted by TOXI SPACE x mental load.agency
Alice Köppel | t_fortuna | Kalixys | nyancrimew | Violeta García | orrrg | Silvan Nicca15.05. Able Noise | Giulio Erasmo & The End of The Worm
18.04. Verbrauch | Kara Delik
25.04. Alice Köppel | Chris Imler
05.04. Leandro Barzabal | Easy Goat | Liegenaar | Leopardo
25.03. Eilis Frawley | Hélöise
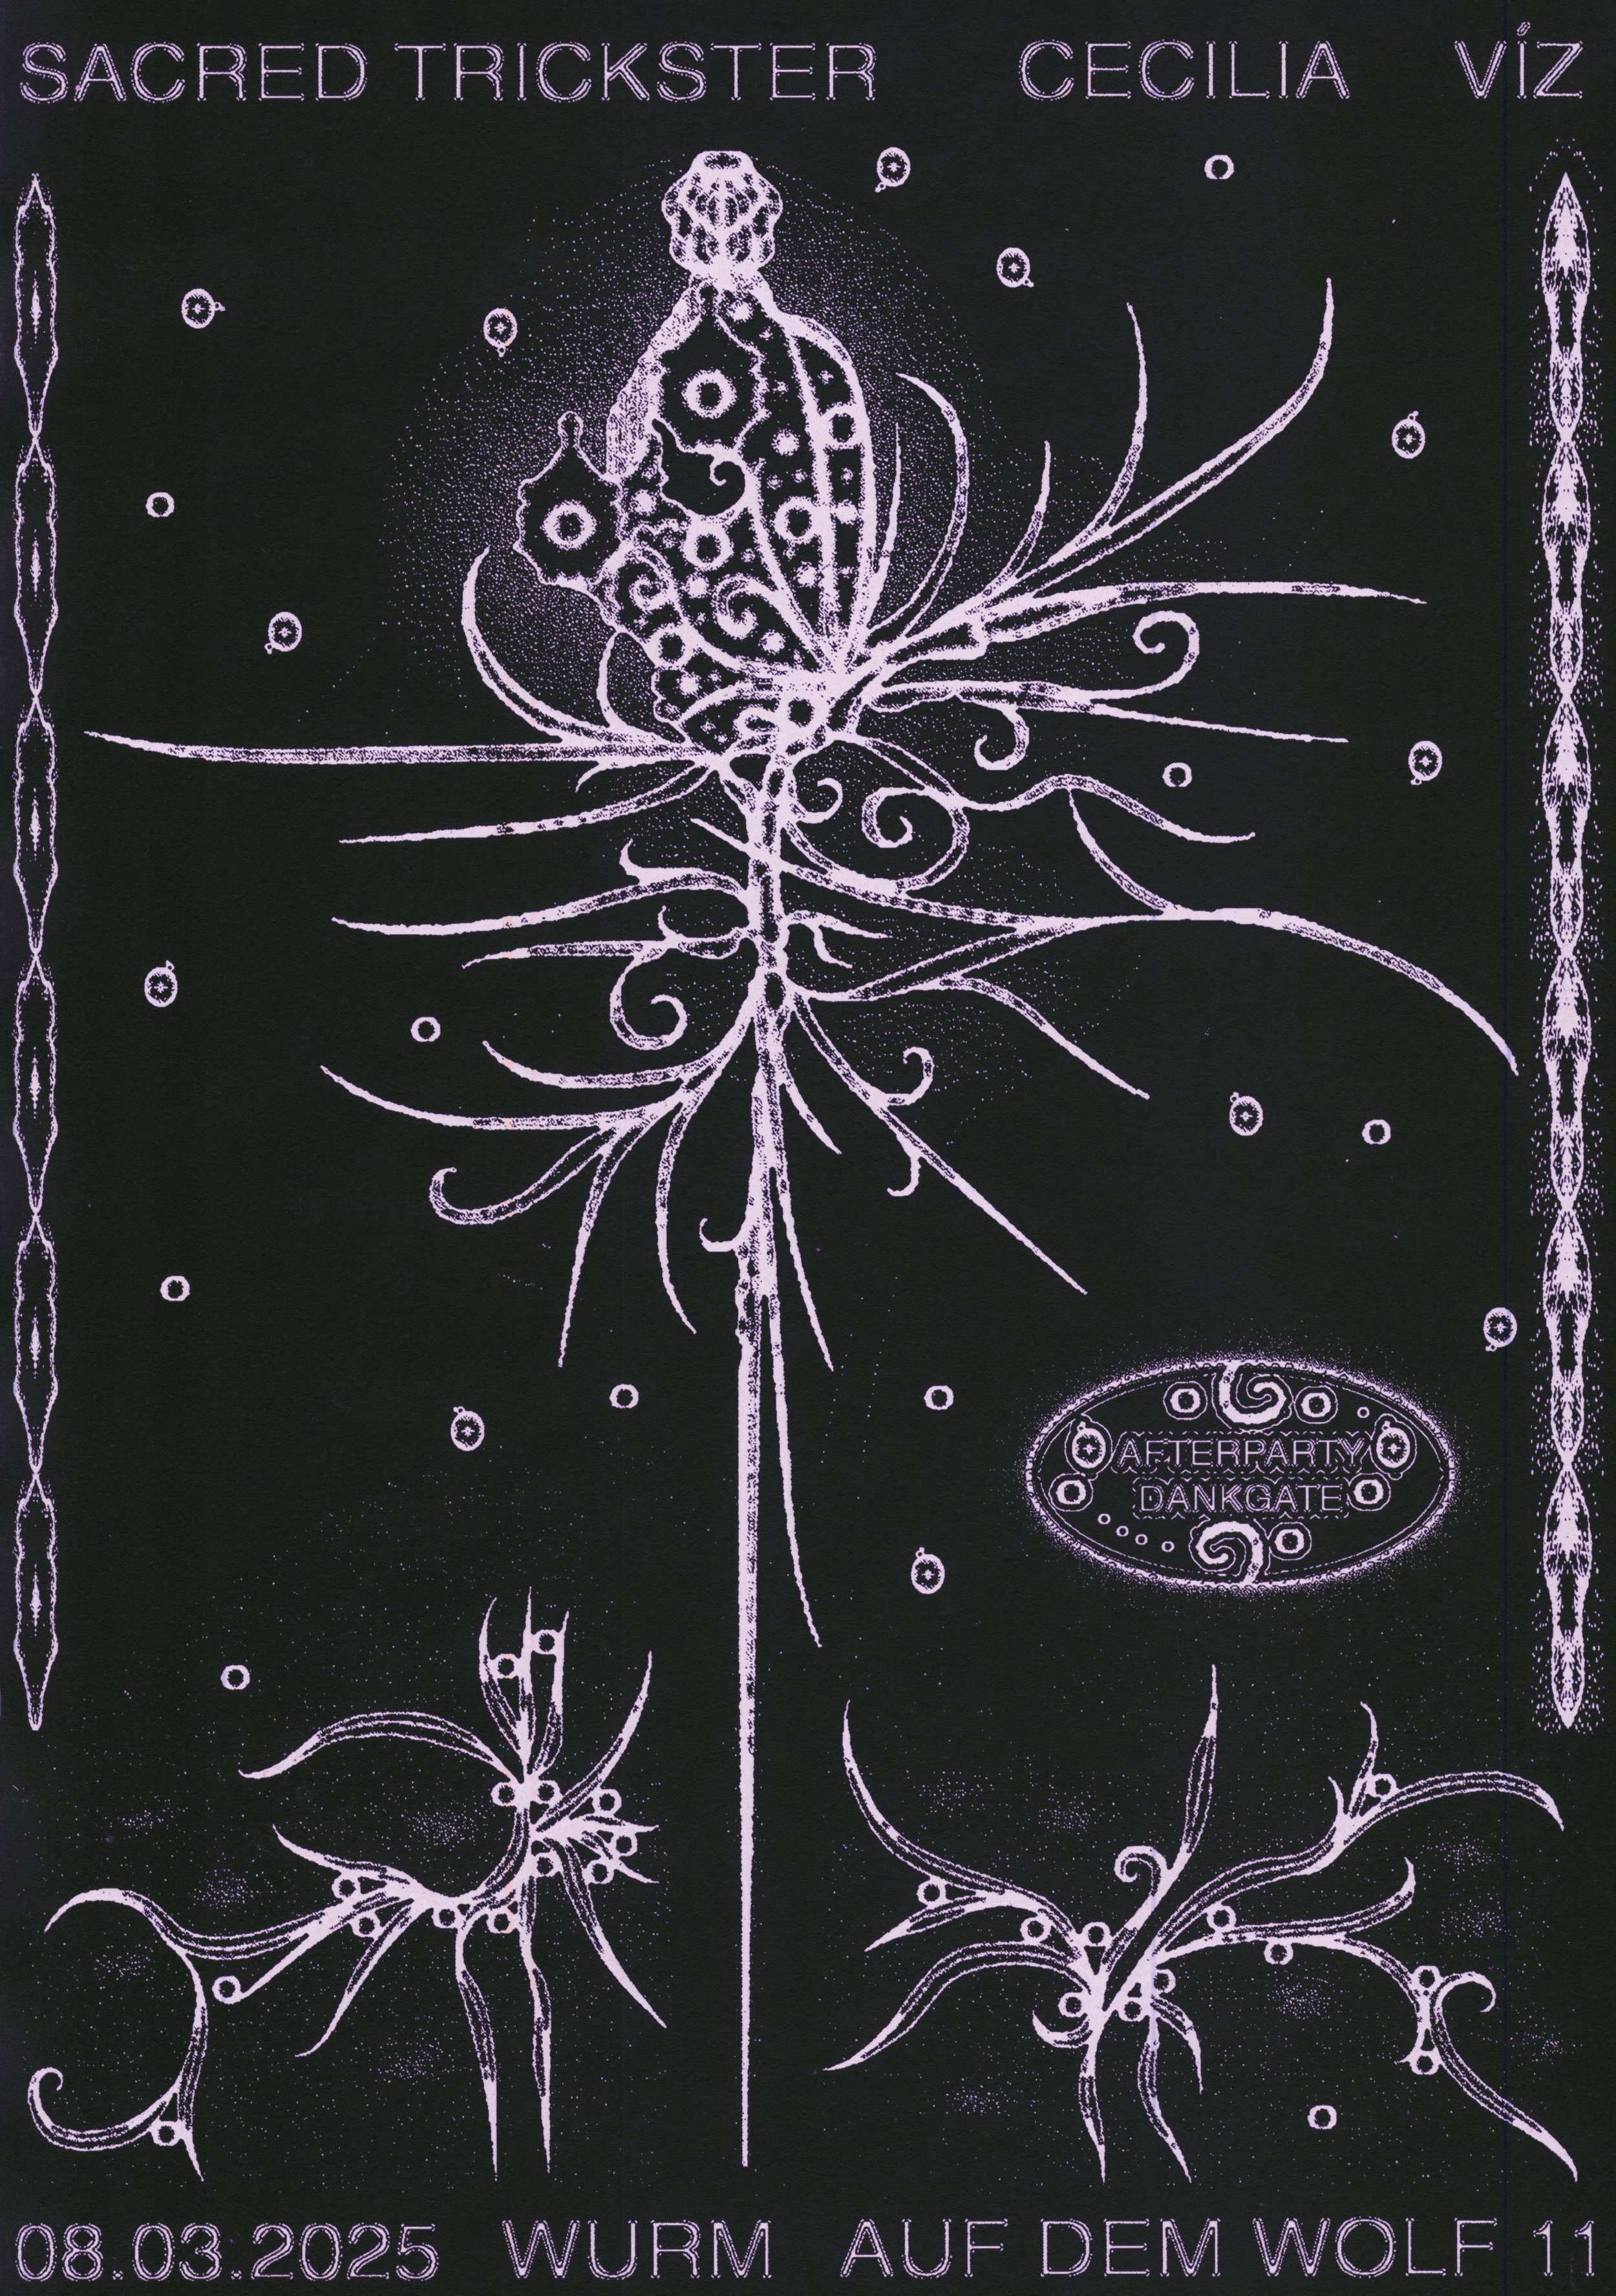
08.03. Víz & Cecilia
23.02. Heliacal Rising of Sothis
26.02. RDH | Anton Ponomarev x Violeta García
25.01. Palestinian Sound Archive / Majazz Projects
10.01. Sun Cousto | Hot Chicks
-
29.12. Die Steifen | Eazy +
12.12. Palme Cadelli | 222Rn: Radon x Film 2 +
29.11. Chien mon Ami | LLäuse (Leoni Leoni x Luzius Schuler) +
22.11. Gøldi Punx | 2M2 +
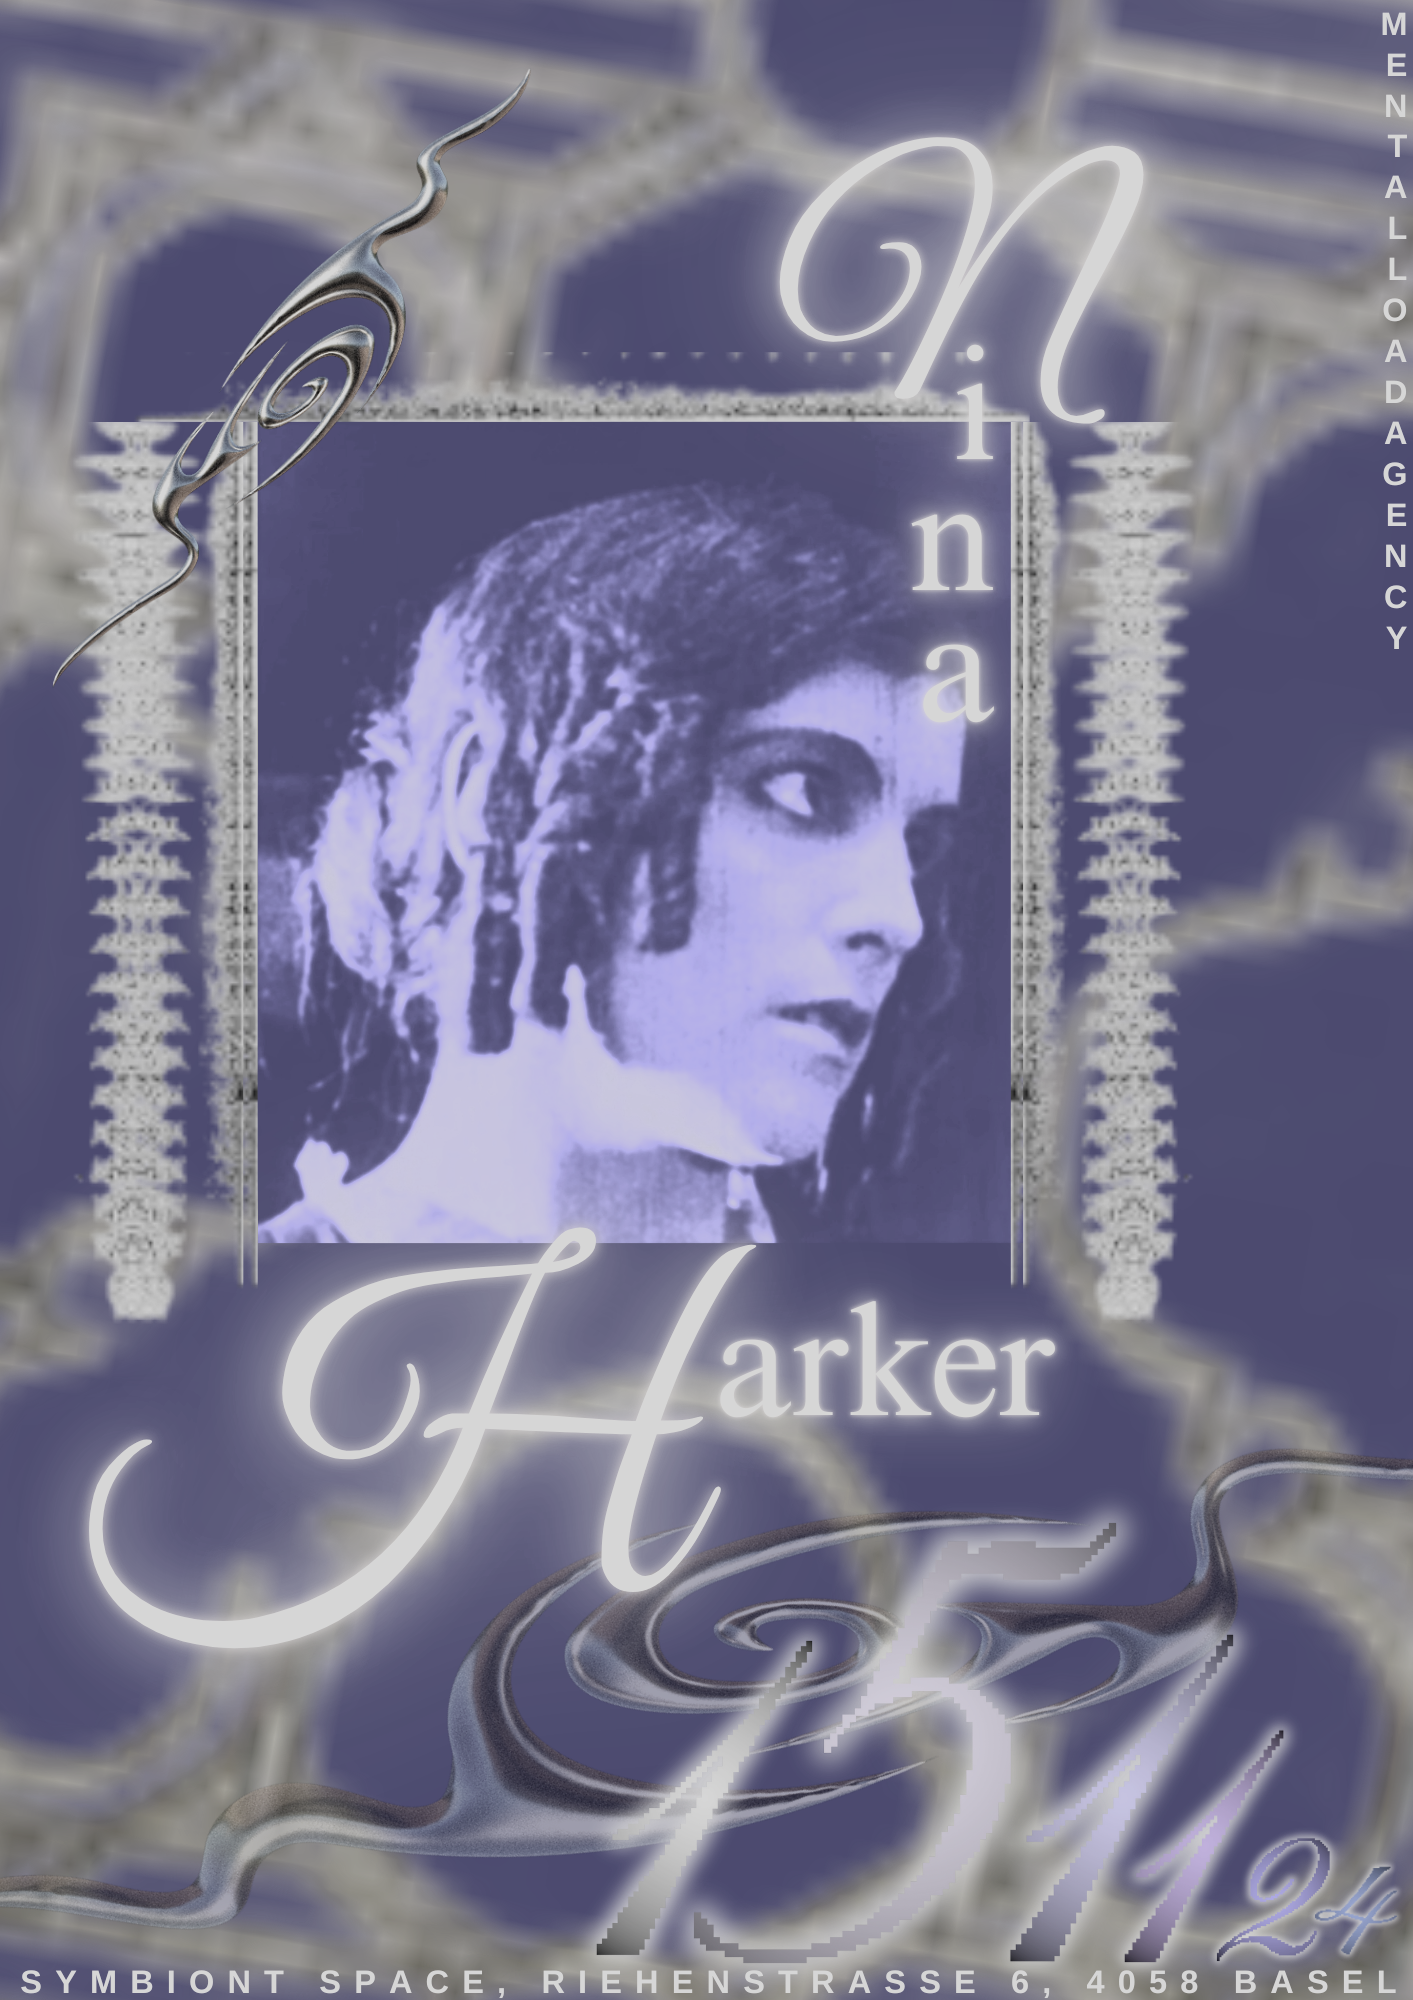
15.11. Nina Harker ±
17.11. Basta Now! - Women, Trans & Non-binary in Experimental Music -Fanny Chiarello | Bolts of Lace (Taimashoe + Vivian Wang) *
24.10. Melodie Blaison
18.10. Cuntroaches | Guttersnipe | Ka Baird *
26.09. Highway Patrol | Stalag +
12.08. Anticorpos | Cosmic Vomit. “
08.07. Sihir | Brak *
24.05. Trholz | yccy. *
11.05. hmot | Nick Klein *
20.04. Augenwasser *
08.04. fotokiller | Cold Summer +
21.03. Sécretariat | Ilios. *
15.03. Bravo Tounky ≠
13.03. Hot Chicks | Good Life Service *
22.02. Les Trucs | Trystero *
16.02. Das Schrei Nicht So Orkestra - Jonas Albrecht ç
08.02. Smile ç
25.01. Elvis Aloys’ Flutorama ^
Venues
* = Wurm.club
+ = Schuppen, Mattenstrasse
“ = Seemenschspelunke Quarterdeck
± = Symbiont Space
^ = Plattfon Records
ç = Humbug.club
≠ = Secret Location -
21.12. Nelly Schweiz ç
01.12. Gøldi | Lynchen +
01.11. Wax Legs +
22.10. Die Türen ”
06.10. Divine Sentence +
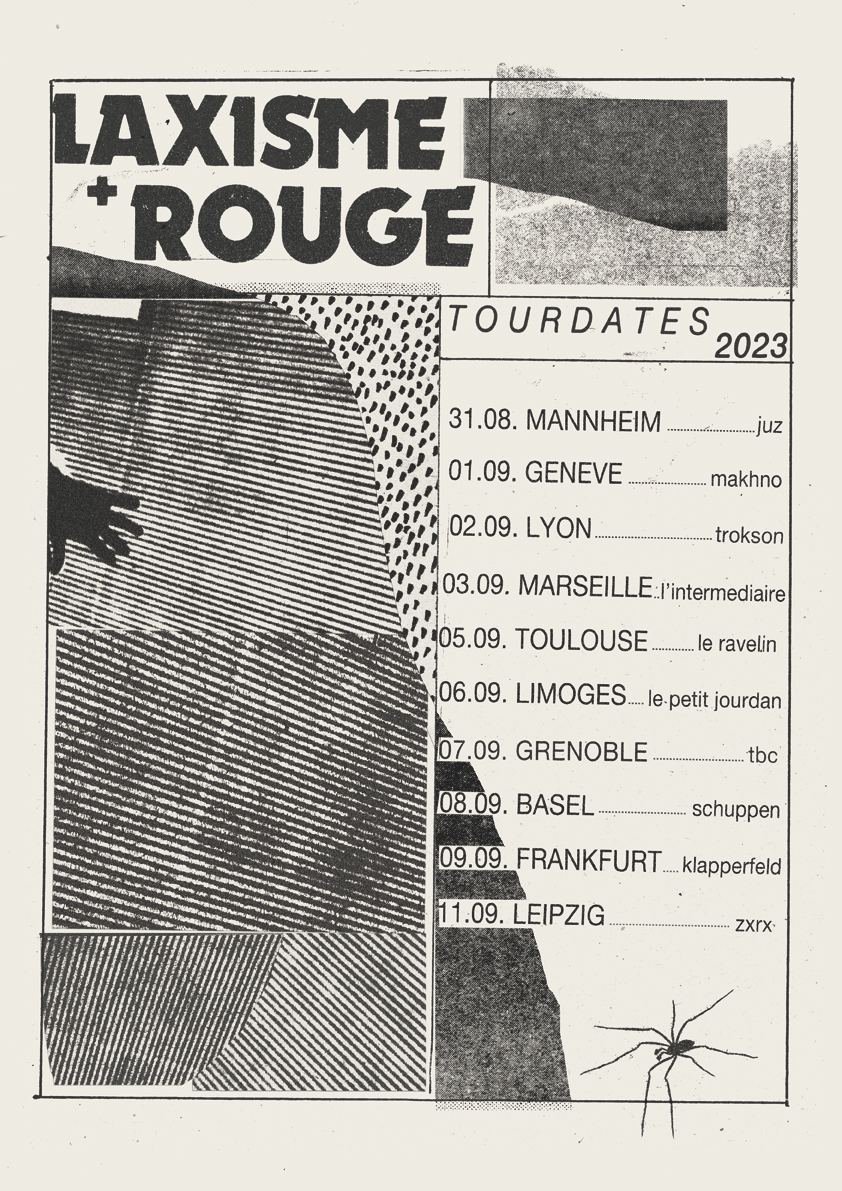
08.09. Rouge | Laxisme +
01.07. Nation Zero & Lewis Beauchamp +
29.06. Lucta +
03.05. Teufelskeller | Iman +
16.03. Siksa | Oblique +
10.03. Klangklinik | Alain Meyer +
Venues
* = Wurm.club
+ = Schuppen, together with Mattenstrasse Collective
“ = Seemenschspelunke Quarterdeck
ç = Humbug.club -
26.11. Final Wurm Quest: Axel Kolb | XV06Y | DJ Würm | Brooklyn Bridge | Diejay Varni
27.10. Papiro | Ruhail Qaisar | Massimo Toniutti | Frau Zwei (in collab with Michi Zaugg)
14.10. Frog Quest: Pr1nc1p3ss4 | Sicc Puppy | Golce Dabbana
29.09. Bibione | YCCY
30.09. Frog Quest: Oohshee & Color Passion | Ayshat Campbell/TVBXS | Endobliss
06.08. Frog Quest: Ana Jikia | Avia | Orrg
02.08. Urin & Desintegraciòn Violenta
Venues
all @ Wurm.club -
Humbug.club (2021-2024)
Collaborations with Delfi Literaturmagazin, BuchBasel, Schwarzer Peter, Migranten helfen Migranten, Slap me Baby Sticker Collective, Safety First, Neues Kino, Luststreifen Filmfestival, Grauer Block, Inaya Solinetworkapprox. 55 concerts per year, curated together with Gian Luca Hoffmann & Nadja Bührer. Later with Iva Prepotić <3
selected shows/curation for Humbug.club
Deli Girls, Alte Sau, Maulgruppe, Bully Fae Collins, Husbands Y&Y (Yann Slattery & Yvhenia Kravets), Hans Unstern, Plattenbau, Kara Delik, Güner Künier, Das Kinn, Raja Kirik, Film2, A Place to Bury Strangers, Jessica Jurassica, Comfort, Samuel Tschudin, Filet Strongenough, The Burning Hell, Björn Magnusson, Leatherette, Crème Solaire & Nathalie Fröhlich, Joviale, Yao Bobby & Simon Grab, A Place To Bury Strangers, Sara Hebe, Delish Da Goddess, Pisse, Seyda Kurt and many more.


© concerts by sacred trickster (all sacred trickster posters by impeccable & unmatched artist ramon keimig)


© concerts by mental load agency (all posters by mental load agency)